Machine learning
Support Vector Machine (SVM):
A supervised machine learning approach called Support Vector Machine (SVM) is employed for classification and regression analysis.
Finding a hyperplane that maximally separates the data points of several classes is the aim of SVM.
SVM identifies a line or a hyperplane that divides the data into two groups in a binary classification task.
SVM operates by calculating the maximum margin, which is the separation between the nearest data points from each class and the hyperplane.
The support vectors, from which the term "Support Vector Machine" derives, are the data points closest to the hyperplane.
The margin might be considered as the decision border or the area of greatest uncertainty.
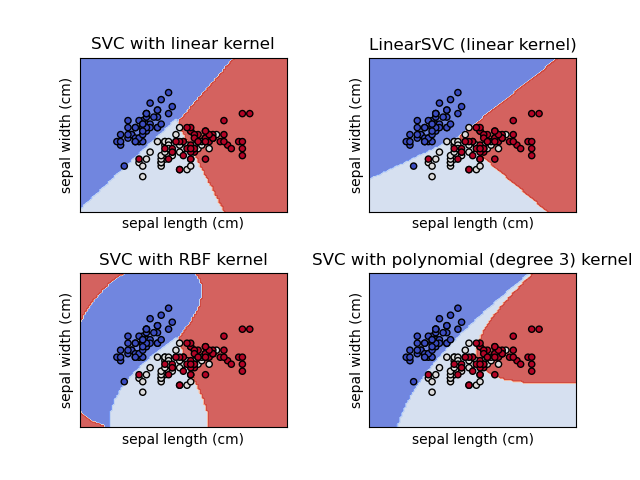
Figure E.1. On a dataset, the classes SVC, NuSVC, and LinearSVC may do binary and multi-class classification.
SVM aims to maximize this margin since a greater margin generalizes to unknown data more effectively.
SVM employs a kernel function to transform the data into a higher dimensional space, where it is more likely to be separable, in circumstances where the data is not linearly separable.
The linear kernel, polynomial kernel, and radial basis function (RBF)
kernel are a few common kernel functions used in SVM.
SVM provides a variety of benefits over other methods, including the
ability to handle high-dimensional data, effectiveness when the number
of features exceeds the number of samples, and reduced propensity for
overfitting.
SVM may not scale well to very big datasets and may be computationally expensive.
SVM is a robust and popular machine learning technique that has applications in a variety of areas, including image recognition, text classification, and bioinformatics.
A demonsration is shown below :
Codeblock E.1. SVM demonstration.
Using the load_iris() function from sklearn.datasets, we first load the iris dataset in this demonstration. The train_test_split() function from sklearn.model_selection was then used to divide the dataset into training and testing sets.
Next, we use the SVC() function from sklearn.svm to build an instance of the SVM classifier with a linear kernel. Using the fit() technique, we adjusted the classifier to the training set of data.
The predict() method is then used to create predictions on the testing data, and the accuracy_score() function from sklearn.metrics is used to measure the classifier's accuracy.
The results are then displayed using the scatter() method from matplotlib.pyplot, with the colored spots representing the predicted classes. We also give the axes names and give the plot a title.

Figure E.1. The SVM graph for the IRIS dataset.
Click the below button to get access to the above ipynb file.

Download. Download the Support Vector Machine.ipynb files used here.
---- Summary ----
As of now you know all basics of Support Vector Machines.
-
SVM is a supervised machine learning method, which means it needs labeled training data to draw its conclusions from.
-
Regression and classification: SVM is a tool that may be used for both types of jobs. SVM searches for a hyperplane that maximum separates the data points of various classes while classifying data. SVM searches for a hyperplane in regression that minimizes the space between it and the data points.
-
Maximum margin: SVM seeks to identify a hyperplane that maximizes the margin, which is the separation between the hyperplane and the nearest data points for each class. Support vectors are the data points that are most closely spaced from the hyperplane.
-
SVM transforms the data into a higher dimensional space, where it is more likely to be separable, using a kernel function. The linear kernel, polynomial kernel, and radial basis function (RBF) kernel are a few common kernel functions used in SVM.
-
Regularization parameter: The regularization parameter in SVM regulates the trade-off between increasing margin and reducing classification error. A low value of the regularization parameter will provide a broader margin but may result in underfitting, whereas a high value will produce a narrow margin and perhaps lead to overfitting.
-
Continuous and categorical data: SVM can handle both types of data. Using one-hot encoding or other methods, categorical data can be transformed into numerical data.
Scalability: SVM may not scale well
to very big datasets and can be computationally expensive. The
scalability of SVM can be enhanced by methods like stochastic
gradient descent (SGD) and kernel approximation.
Applications: SVM is used in a wide range of industries, including
banking, bioinformatics, image recognition, and text categorization.
etc..
________________________________________________________________________________________________________________________________

________________________________________________________________________________________________________________________________