
Machine learning
Principal Component Analysis :
Principal Component Analysis (PCA) is a statistical technique used to reduce the dimensionality of a large dataset.
It does this while preserving as much of the original data as possible by locating the underlying patterns and relationships in the data and projecting them onto a lower-dimensional space.
PCA is frequently employed in industries where a lot of data needs to be evaluated and understood, including finance, engineering, and biology.
When working with high-dimensional datasets, the approach is especially helpful since it can help to pinpoint the data's most crucial features or variables while minimizing noise and redundancy.
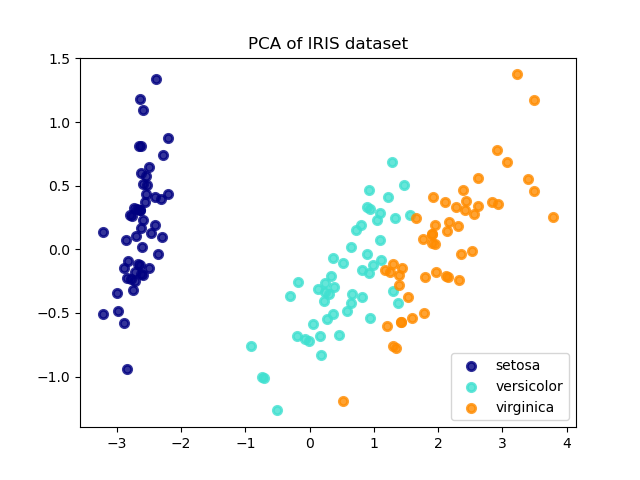
Figure E.1. The Setosa, Versicolor, and Virginica varieties of Iris flowers are represented by the dataset's four sepal, sepal width, petal, and petal length attributes.
The fundamental principle underlying PCA is to convert the original dataset into a new coordinate system in which the first axis (or principal component) represents the majority of data variance, the second axis captures the second-largest amount of variation, and so on.
The total amount of variation represented by all the axes is equal to the total variance in the original data, and each axis is orthogonal (perpendicular) to all the other axes.
Calculating the data covariance matrix's eigenvalues and eigenvectors is a step in the process of identifying the primary components.
The associated eigenvalues show how much variation is contained by each eigenvector, and the eigenvectors themselves show the direction of maximum volatility in the data.
The original data can be projected onto a lower-dimensional space once the primary components have been determined.
This can be accomplished by taking the original data matrix and multiplying it by the matrix of eigenvectors corresponding to the first k principal components, where k is the desired number of dimensions.
The output matrix will have the same number of rows as the initial data matrix and k columns (corresponding to the k principal components).
Data visualization, feature selection, and data compression are just a few of the many uses for PCA, a robust technique for data analysis.
However, it is crucial to remember that PCA is not a magic fix for all data analysis issues.
The results must be interpreted carefully, and further research may be necessary to completely comprehend the underlying trends and connections in the data.
Codeblock E.1. Principal Component Analysis demonstration.
Click the below button to get access to the above ipynb file.

Download. Download the ipynb files used here.
---- Summary ----
As of now you know all basics of Principal Component Analysis.
-
High-dimensional datasets can be reduced in dimension using the statistical method known as PCA.
-
The objective of PCA is to re-coordinate the data so that the axes are parallel to the directions with the greatest variation.
-
PCA works by identifying the dataset's principle components, or the directions in the feature space that account for the majority of the data's volatility.
-
The direction of the largest variation is the first main component, followed by the direction of the second largest variance, and so on. All of the primary components are orthogonal to one another, or perpendicular.
-
Because it may be used to find patterns and relationships in high-dimensional data, PCA is frequently employed for data visualization and exploratory analysis.
-
etc..
________________________________________________________________________________________________________________________________

________________________________________________________________________________________________________________________________