
Machine learning
Logistic Regression:
A For binary classification problems, where the goal variable can only take on the values of 0 or 1, the statistical model of logistic regression is applied.
It is a well-liked algorithm for binary dependent variable problems in machine learning.
The logistic function, commonly known as the sigmoid function, is the foundation of logistic regression.
It maps any real-valued number to a value between 0 and 1.
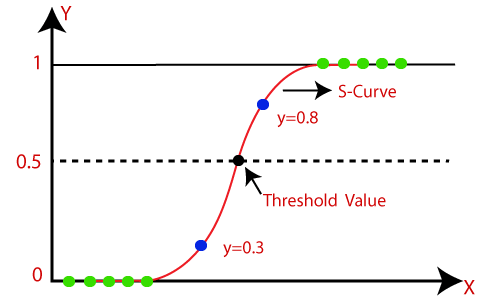
Figure E.1. A logisitc Regression Curve.
An S-shaped curve, having a midpoint at x=0 and asymptotes at y=0 and y=1, characterizes the logistic function.
Based on one or more predictor variables, the logistic regression model calculates the likelihood of a binary result. It assumes that there is a linear relationship between the predictor factors and the binary outcome's log-odds.
The inverse of the logistic function, the log-odds of the binary result is often referred to as the logit function. It comes from:
logit(p) = log(p / (1 - p))
where p denotes the likelihood of a binary result.
We attempt to determine the coefficients of the predictor variables in logistic regression that maximize the likelihood of the observed data.
This is accomplished by minimizing a cost function, such as the cross-entropy loss or the negative log-likelihood.
Different optimization procedures, such as gradient descent, Newton's method, or quasi-Newton methods, can be used to train the logistic regression model.
The likelihood of the binary result for additional data points can be predicted using the logistic regression model after it has been trained.
The model predicts a positive outcome (1) if the estimated probability is greater than or equal to a threshold number, often 0.5; otherwise, it predicts a negative outcome (0).
A few benefits of logistic regression include being a straightforward and understandable model, having a cheap computing cost, and being noise-resistant.
Additionally, it is susceptible to outliers and assumes a linear relationship between the predictor variables and the log-odds.
A demonsration is shown below :
Codeblock E.1. Logisitc Regression demonstration.
This program shows how to apply logistic regression to a created dataset for binary classification. The code is broken down as follows:
Add the required libraries:
1. The numerical operations library numpy
2. The graph-plotting tool matplotlib.pyplot
3. To create a synthetic dataset, use make_classification from sklearn.datasets.
4. To divide the dataset into training and testing sets, use the train_test_split function from sklearn.model_selection.
5. To build an instance of the class Logistic Regression, use the LogisticRegression method from sklearn.linear_model.
6. To assess the effectiveness of the classifier, use the accuracy_score and confusion_matrix from sklearn.metrics.
Use the make_classification function to create a synthetic dataset for binary classification. This function creates a random dataset with the parameters you specify, such as the sample size, the number of features, the degree of class separation, etc.
Using the train_test_split function, divide the dataset into training and testing sets. This function divides the data into predetermined proportions at random.
Make a new instance of the class LogisticRegression.
Utilize the classifier object's fit method to adjust the classifier to the training set of data.
Utilize the classifier object's predict method to make predictions based on the testing data.
Utilize the accuracy_score function in sklearn.metrics to assess the classifier's accuracy.
Utilize the matplotlib.pyplot library to plot the testing data and the decision boundary.
The meshgrid of points that covers the feature space is used to forecast the class labels, which yields the decision boundary. The contourf function is then used to plot the outcome.
The scatter function is also used to visualize the test data. The graph is labeled using the xlabel, ylabel, title, and colorbar functions.

Figure E.1. Logisitc regression classification made on generated data.
Utilize the confusion_matrix function in sklearn.metrics to compute and plot the confusion matrix.
The classifier's true positive, false positive, true negative, and false negative predictions are displayed in the confusion matrix.
The imshow function of matplotlib.pyplot is then used to plot the outcome.
The graph is labeled using the set_xticks, set_yticks, set_xticklabels, set_yticklabels, set_xlabel, set_ylabel, set_title, and colorbar functions.

Download. Download the Logisitc regression.ipynb files used here.
---- Summary ----
As of now you know all basics of Logistic Regression.
-
A supervised learning approach called logistic regression is used to resolve binary classification issues where the output variable is a binary label (0 or 1).
-
It is based on the logistic function, often known as the sigmoid function, which converts any input value into a number between 0 and 1.
-
To determine the ideal model parameter values that maximize the probability of the observed data, logistic regression employs the Maximum probability Estimation (MLE) method.
-
Gradient descent is an iterative technique used to learn the model parameters in Logistic Regression.
-
Both linearly separable and non-linearly separable data can be handled via logistic regression.
-
The linear relationship between the input features and the output variable is the underlying premise of logistic regression.
-
Metrics including accuracy, precision, recall, and F1-score are used to assess the effectiveness of the Logistic Regression model.
-
Numerous applications, including credit scoring, customer churn prediction, fraud detection, and medical diagnosis, make extensive use of logistic regression.
etc..
________________________________________________________________________________________________________________________________

________________________________________________________________________________________________________________________________